Rethinking tourism and mobility together in line with a low-carbon transition
While warm weather and below-normal snowfall bring new records to the 2022-2023 season, and despite the cost of living crisis, the demand for holidays has soared this winter. This is in line with the general upward trend of tourism, which has grown continuously over the past decades, representing 10% of the global GDP. However, 75% of the sector’s GHG emissions are related to transport, as tourism has been mostly structured around air and car infrastructure. Thus, the tourism industry has an increasingly adverse impact on the environment. Rethinking transport connectivity, designing attractive low carbon tours, and decarbonizing the transport industry will be important parts of the solution to reduce the sector’s emissions. For tourism to keep delivering prosperity and well-being without threatening our climate and environment, both governments and companies must act now to steer the entire sector in the right direction.
Key trends of two mobility scenarios compatible with the Paris Agreements
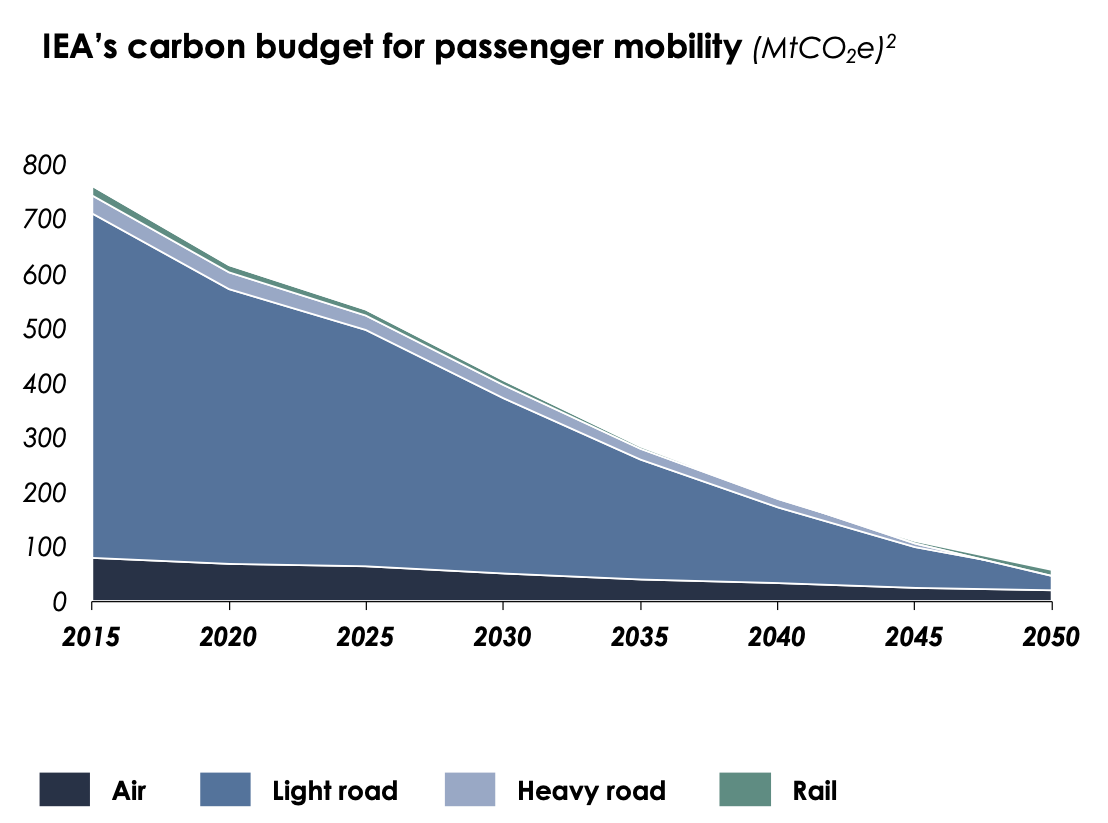
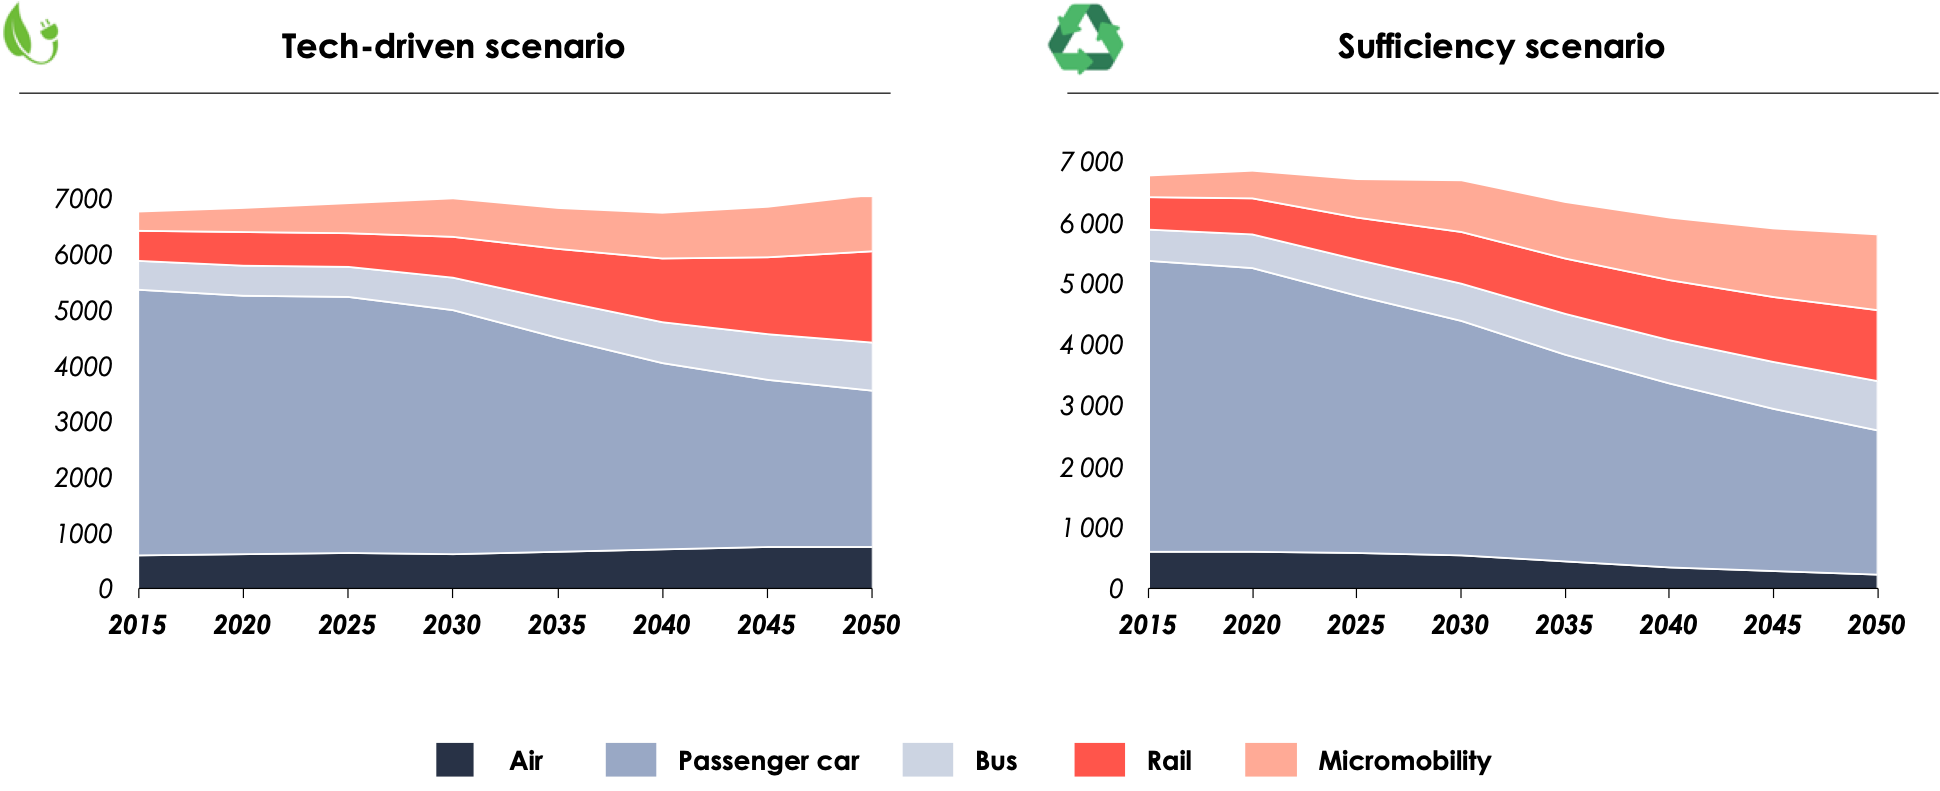
Prospective modeling enables to explore future sectorial developments under carbon constraint. Based on two projected contrasted socioeconomic narratives – a tech-driven scenario and a sufficiency scenario –, Carbone 4’s modeling aims at matching the overall EU passenger mobility CO2 emissions with a carbon budget compatible with the Paris Agreements.
To this end, an approach like the kaya identity[1] enables the break down of overall emissions into contributing factors.
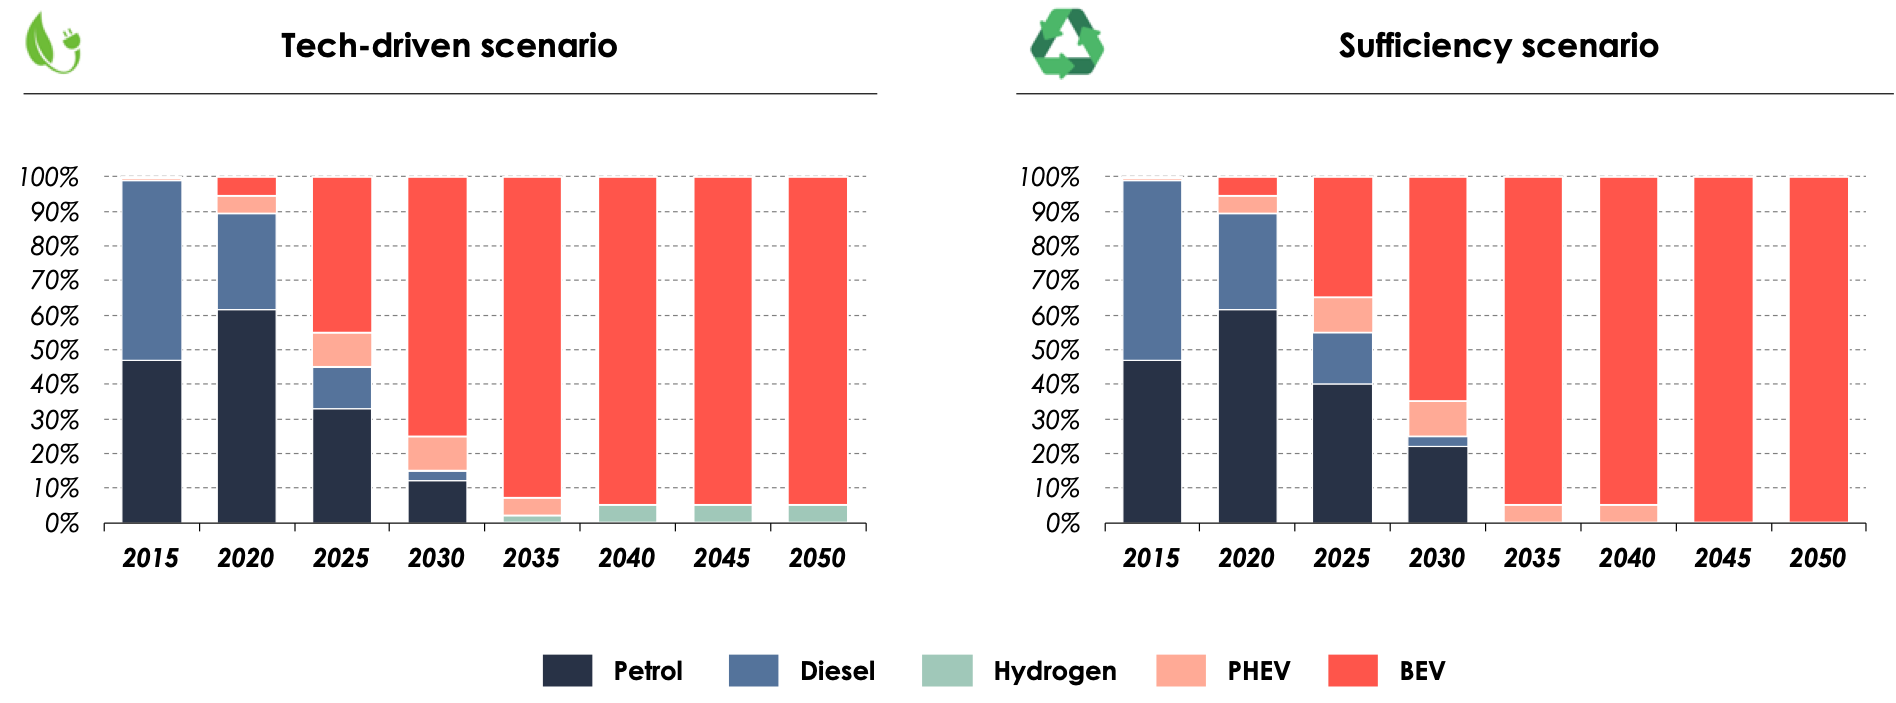
The modeling outputs draw the following key conclusions applicable to both scenarios:
- The mobility volume in passenger-kilometer either stagnates or decreases.
- The air traffic slows down (>1% growth versus 3% historically) or decreases.
- For cars: individual use plunges, the electrification of the fleet is massive, filling rates are high, cars are more energy efficient, smaller and lighter.
Micromobility and public transport modes soar.
Transport is the main source of tourism’s carbon footprint, revealing its dependence on the car and plane industries
According to the French Agency for Ecological Transition (ADEME), the tourism sector in France emitted 118 MtCO2e in 2018, which corresponds to the annual carbon footprint of 11 M French people, and 11% of France’s national GHG emissions inventory. The scope includes domestic tourism, among which incoming tourists (international travellers coming to France), and excludes outbound tourism (French travellers abroad).
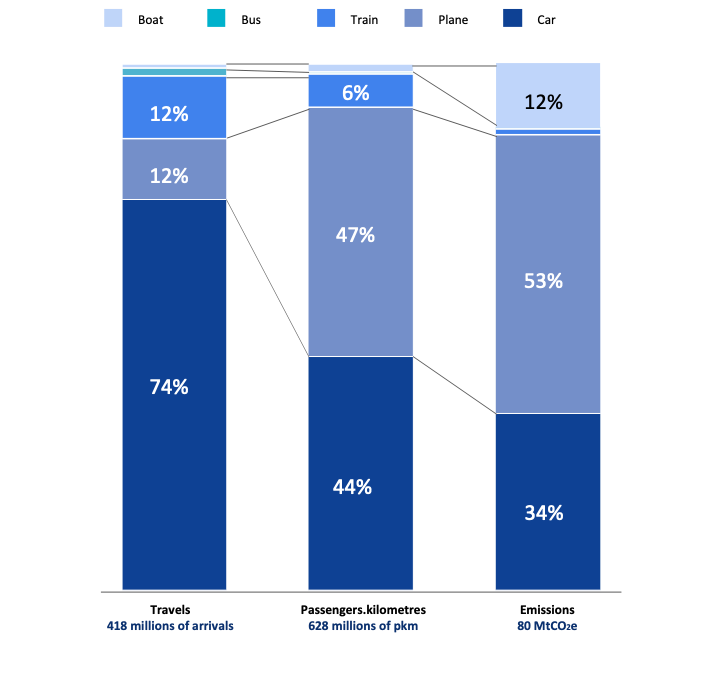
Figures show that 77% of these emissions are generated by tourism mobility, and more specifically 41% by air transport (see graph 5).
Following the kaya identity factors mentioned above, the two parameters that play a leading role in emissions generated by tourism mobility are:
• the number of passenger-kilometers travelled and therefore the distance, and
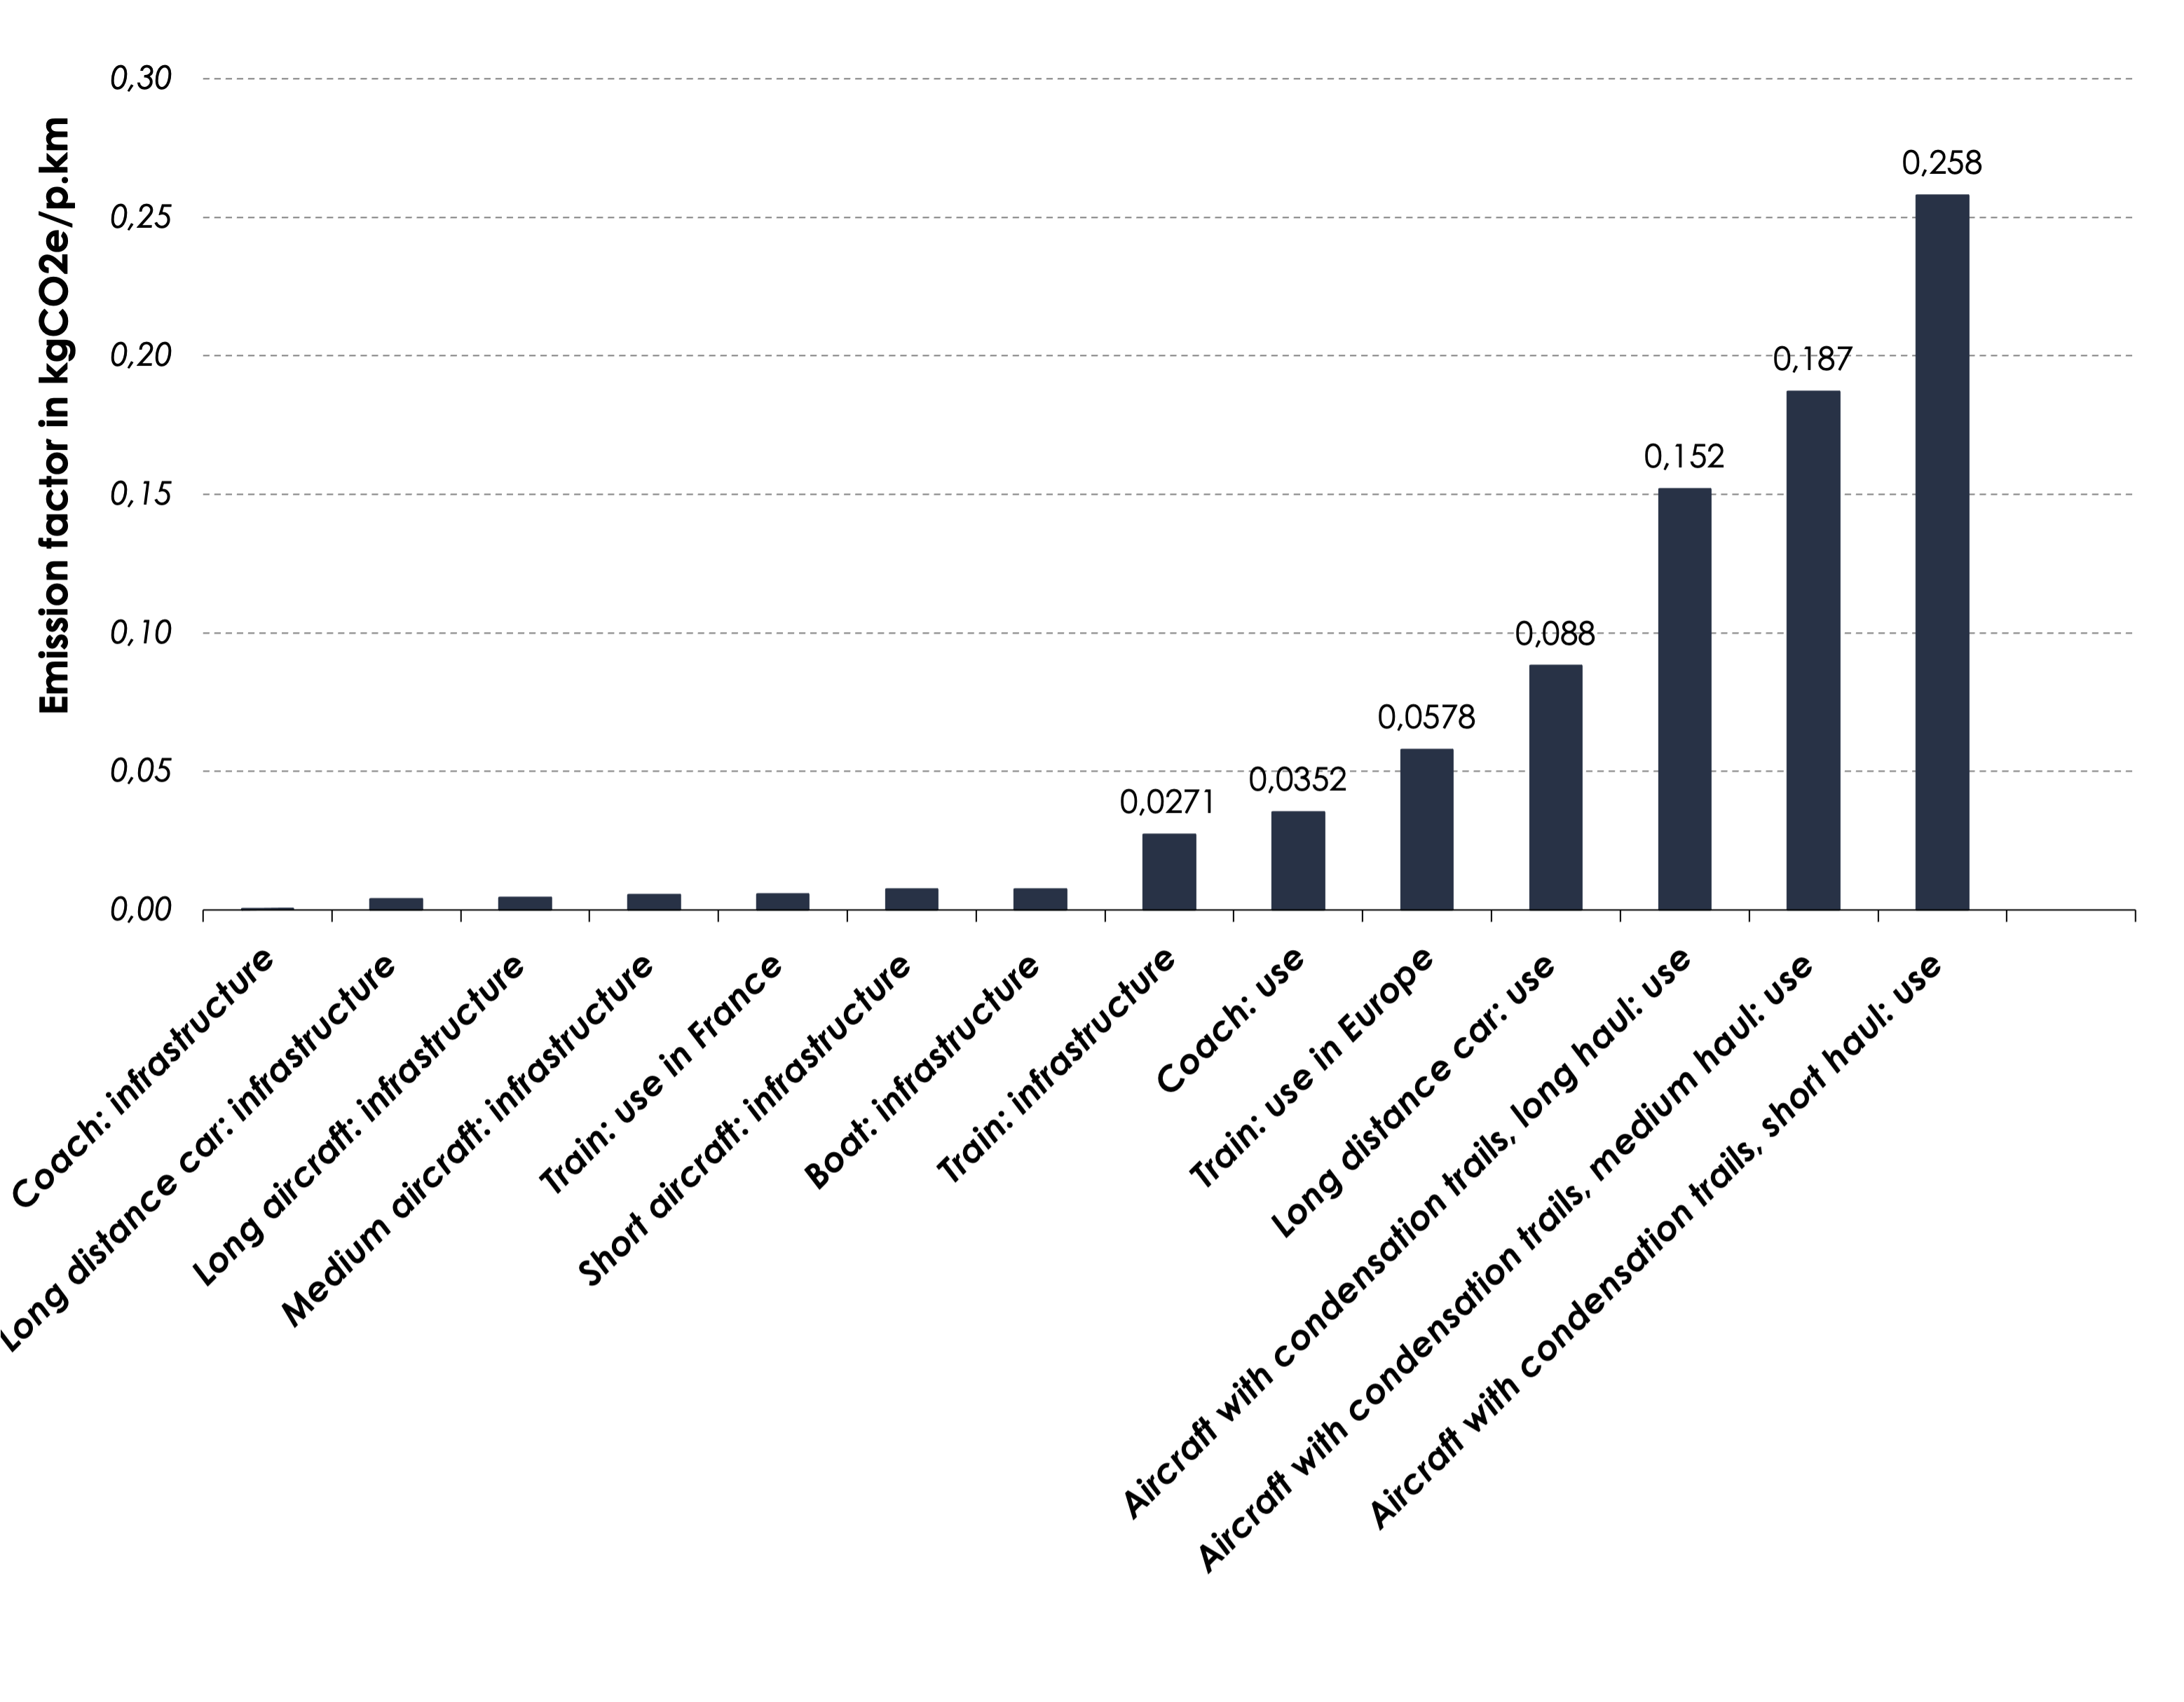
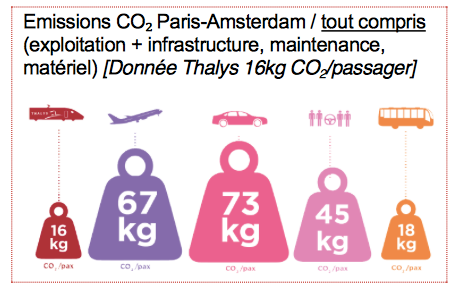
• the emission factor of the transport mode, as shown by the graph 6.
Hence the overweighting of air transport in the total of emissions, and the central role of cars, which represents three quarters of the modal shares. See annex for the emission factors used.
These elements explain that certain forms of tourism show a higher carbon intensity:
• visitors from abroad (“income tourism”) emit more than domestic tourists due to the distance travelled and more passengers travelling by air;
• excursionists (travelling more than 100km from their place of residence in a day) and business tourists (on average more emitting than leisure tourism) are both short stays that overweight the distance travelled related to the duration, and therefore the emissions.
These figures reveal how tourism has been structured around the use of individual cars and the air travel industry. Since the late 20th century, in wealthier societies, the development of car ownership worldwide has opened up new possibilities for leisure travel. Similarly, a holiday abroad plus short breaks and days out have become less of a luxury than cultural expectations. This phenomenon has been compounded by the emergence of low-cost airlines, which have optimized companies’ cost structure and benefited from zero tax on kerosene-based jet fuel to offer very cheap medium-haul flights. The rapid growth of the tourism industry has been driven by fast and cheap access to transport energy resources based on the belief of unlimited access to energy, and aforementioned low tax on jet fuel that improved air transport competitiveness in relation to other transport modes.[2] In parallel, penalized by a higher tax rate and therefore unable to optimize their cost structure in a similar way, many railway lines between cities have disappeared, limiting the ability of the rail network to offer any comparable alternative to such flows of tourism. In addition, some practical aspects of public transports such as service time, interconnexion or arrival at destination can be major obstacles to more sustainable patterns of mobility from tourists. There is a real challenge for tourism stakeholders, and in particular accommodation providers, to promote the public transport options available to get to their destination, especially from train stations, in the so-called "last mile" area. Therefore, structuring the offering of mobility has to take into account the specific needs of tourism, and not only those related to daily mobility.
However, a 2°C carbon budget constraint urges both the transport and the tourism industries to rethink their model and face the challenges caused by the low carbon transition together. In this perspective, the car rental business can be considered as an illustration of reference.
Zoom on the car rental industry
Today’s car rental companies derive a significant share of their income from leisure activity. Highly seasonal, their business model relies first and foremost on summer holidays and airport rental stations. After decades of upward trend in tourism, the Covid-19 sanitary crisis hit, unprecedent pressure on energy prices has followed the Ukraine war – an increase that should continue over the coming decades as carbon taxation is strengthened and fossil fuels are depleted –, and the notions of sufficiency and resilience have been central in the public debate. If car rental companies want to anticipate the shift of the century and remain competitive – not to say simply profitable – over the long run, they must find new ways to offer affordable and practical transportation to people in a tourism model compatible with the physical limits of the planet.
The mobility modeling under carbon constraint enables us to map transition-related risks and opportunities. Among the solutions that emerged were the following.
- In anticipation of new bus and train lines between cities in Europe, rehabilitation of abandoned railroads, and investments in night trains:
- develop railway stations, create partnerships with actors of collective transport and micromobility;
- develop “multi-mobility packs” combining several transportation means – such as a folded electric bike or scooter in the trunk of an electric car;
- make sure that cars are energy efficient and low carbon: small, light and aerodynamic, at the opposite of the trend taken by the automotive manufacturers over the past decades;
- enable car rental companies to have priority on low-carbon hydrogen-powered and heavy battery vehicles fleets, as most of long-distance trips are linked to vacationers.
- In view of the GHG emissions optimization of the automotive fleet, leading to aforementioned energy efficiency, mostly electric cars; the limited development of autonomous cars (due to their noticeably high energy consumption); and the increasing filling rate of cars:
- Create new micromobility services on vacation sites (electric bikes & scooters…).
- Develop new services of electric shuttle, between train stations and city-centers, in city-centers, or to serve touristic places.
- Introduce new offers based on increasing filling rates (e.g., shared rental with the second driver being another B2C customer).
- Slow down or decrease of air traffic, with a sharp decrease of air travel:
- Ending the business model dependance on airport stations.
- Adapt air travel-related car rental solutions to premium offers.
These examples show that, while the shift toward low carbon business models is urgent, a science-based approach to rethink corporate strategy leads to appropriate business solutions.[3] So, what barriers need to be taken down to ease the shift?
Paving the way to an ecosystemic shift
The entire sectorial ecosystem of companies needs to shift toward the same objective. Building on the car rental example, to secure supply chain and electrify the entire car fleet, a renter may consider collaborating with manufacturers. To develop leisure mobility solutions between train stations and cities or in urban low emission zones, a common objective must drive the strategies of all players – train and rental companies, as well as municipalities – to ensure strategic or and/or operational synergies and partnerships. To achieve this ecosystemic shift, the public authorities, both at national and European level, have a leading role in encouraging all economic actors to coordinate towards a planned low carbon transition. This means, for instance, ensuring that the pace of deployment of Infrastructure – such as electric polling stations – is meeting the requirements of the national transition targets.
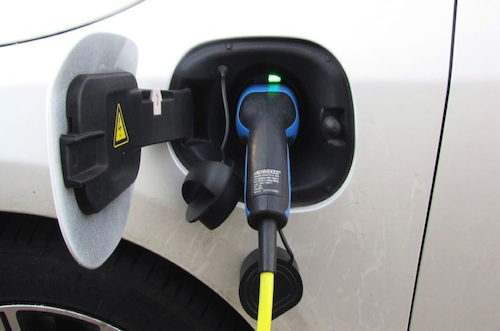
The second main barrier is the consumer preference. Companies may develop low carbon solutions, but without certainty that final consumers will be willing to adopt them. For now, car rental companies have more difficulty renting electric cars than internal combustion cars. Part of the problem is the perceived lesser practicality of these new vehicles: the need to find charging polls and uncertainties regarding the battery autonomy. When it comes to the need to develop infrastructure at the right pace, public planification and alignment with the reference ratio of the EU will be key. Moreover, rental companies can consider it as a new opportunity investment, as it is the case with the expected boom of battery recycling market. Yet, besides the infrastructure dimension, the consumer preference takes its deeper roots within the social segments, the societal paradigm, and beliefs. Sociologists teach us that ways of life are the outcome, not the entry points, not only of infrastructural context, but also of personal dispositions acquired through several socialization processes. Therefore, to prompt a change in people’s behavior entails, in practice, to transform the collective framework such as desirability, accessibility or legitimacy, of a society that today is structured around the value of abundance.[4] The social valuation of sufficiency must become a sociopolitical project, associated with positive promises. With adequate business models, ads, communications, KPIs and strategies, companies have all their place on the way.

